

H1 2026: Winners, Losers, and What’s Coming Next
The biggest market rotation of 2026 — and why inflation could end it all


100 billion
That's how many transistors IBM says its new prototype chip can fit onto an area roughly the size of a fingernail.

Why investors are dumping Big Tech for memory chips
How inflation could derail the second half of 2026
The stock market is the second most expensive in history

H1 2026 Market Review: Why Investors Are Dumping Big Tech for Memory Chips
The first half of 2026 is coming to a close. It’s been a volatile six months — marked by a war with Iran, persistent inflation, and a major transition in the AI trade.
The old winners have become the laggards. The hyperscalers, Microsoft, Alphabet, Amazon, Meta, and Oracle, have solidly underperformed the market. Microsoft is on track for its worst monthly loss since 2008, down 20% in June alone. Oracle is down 30%.
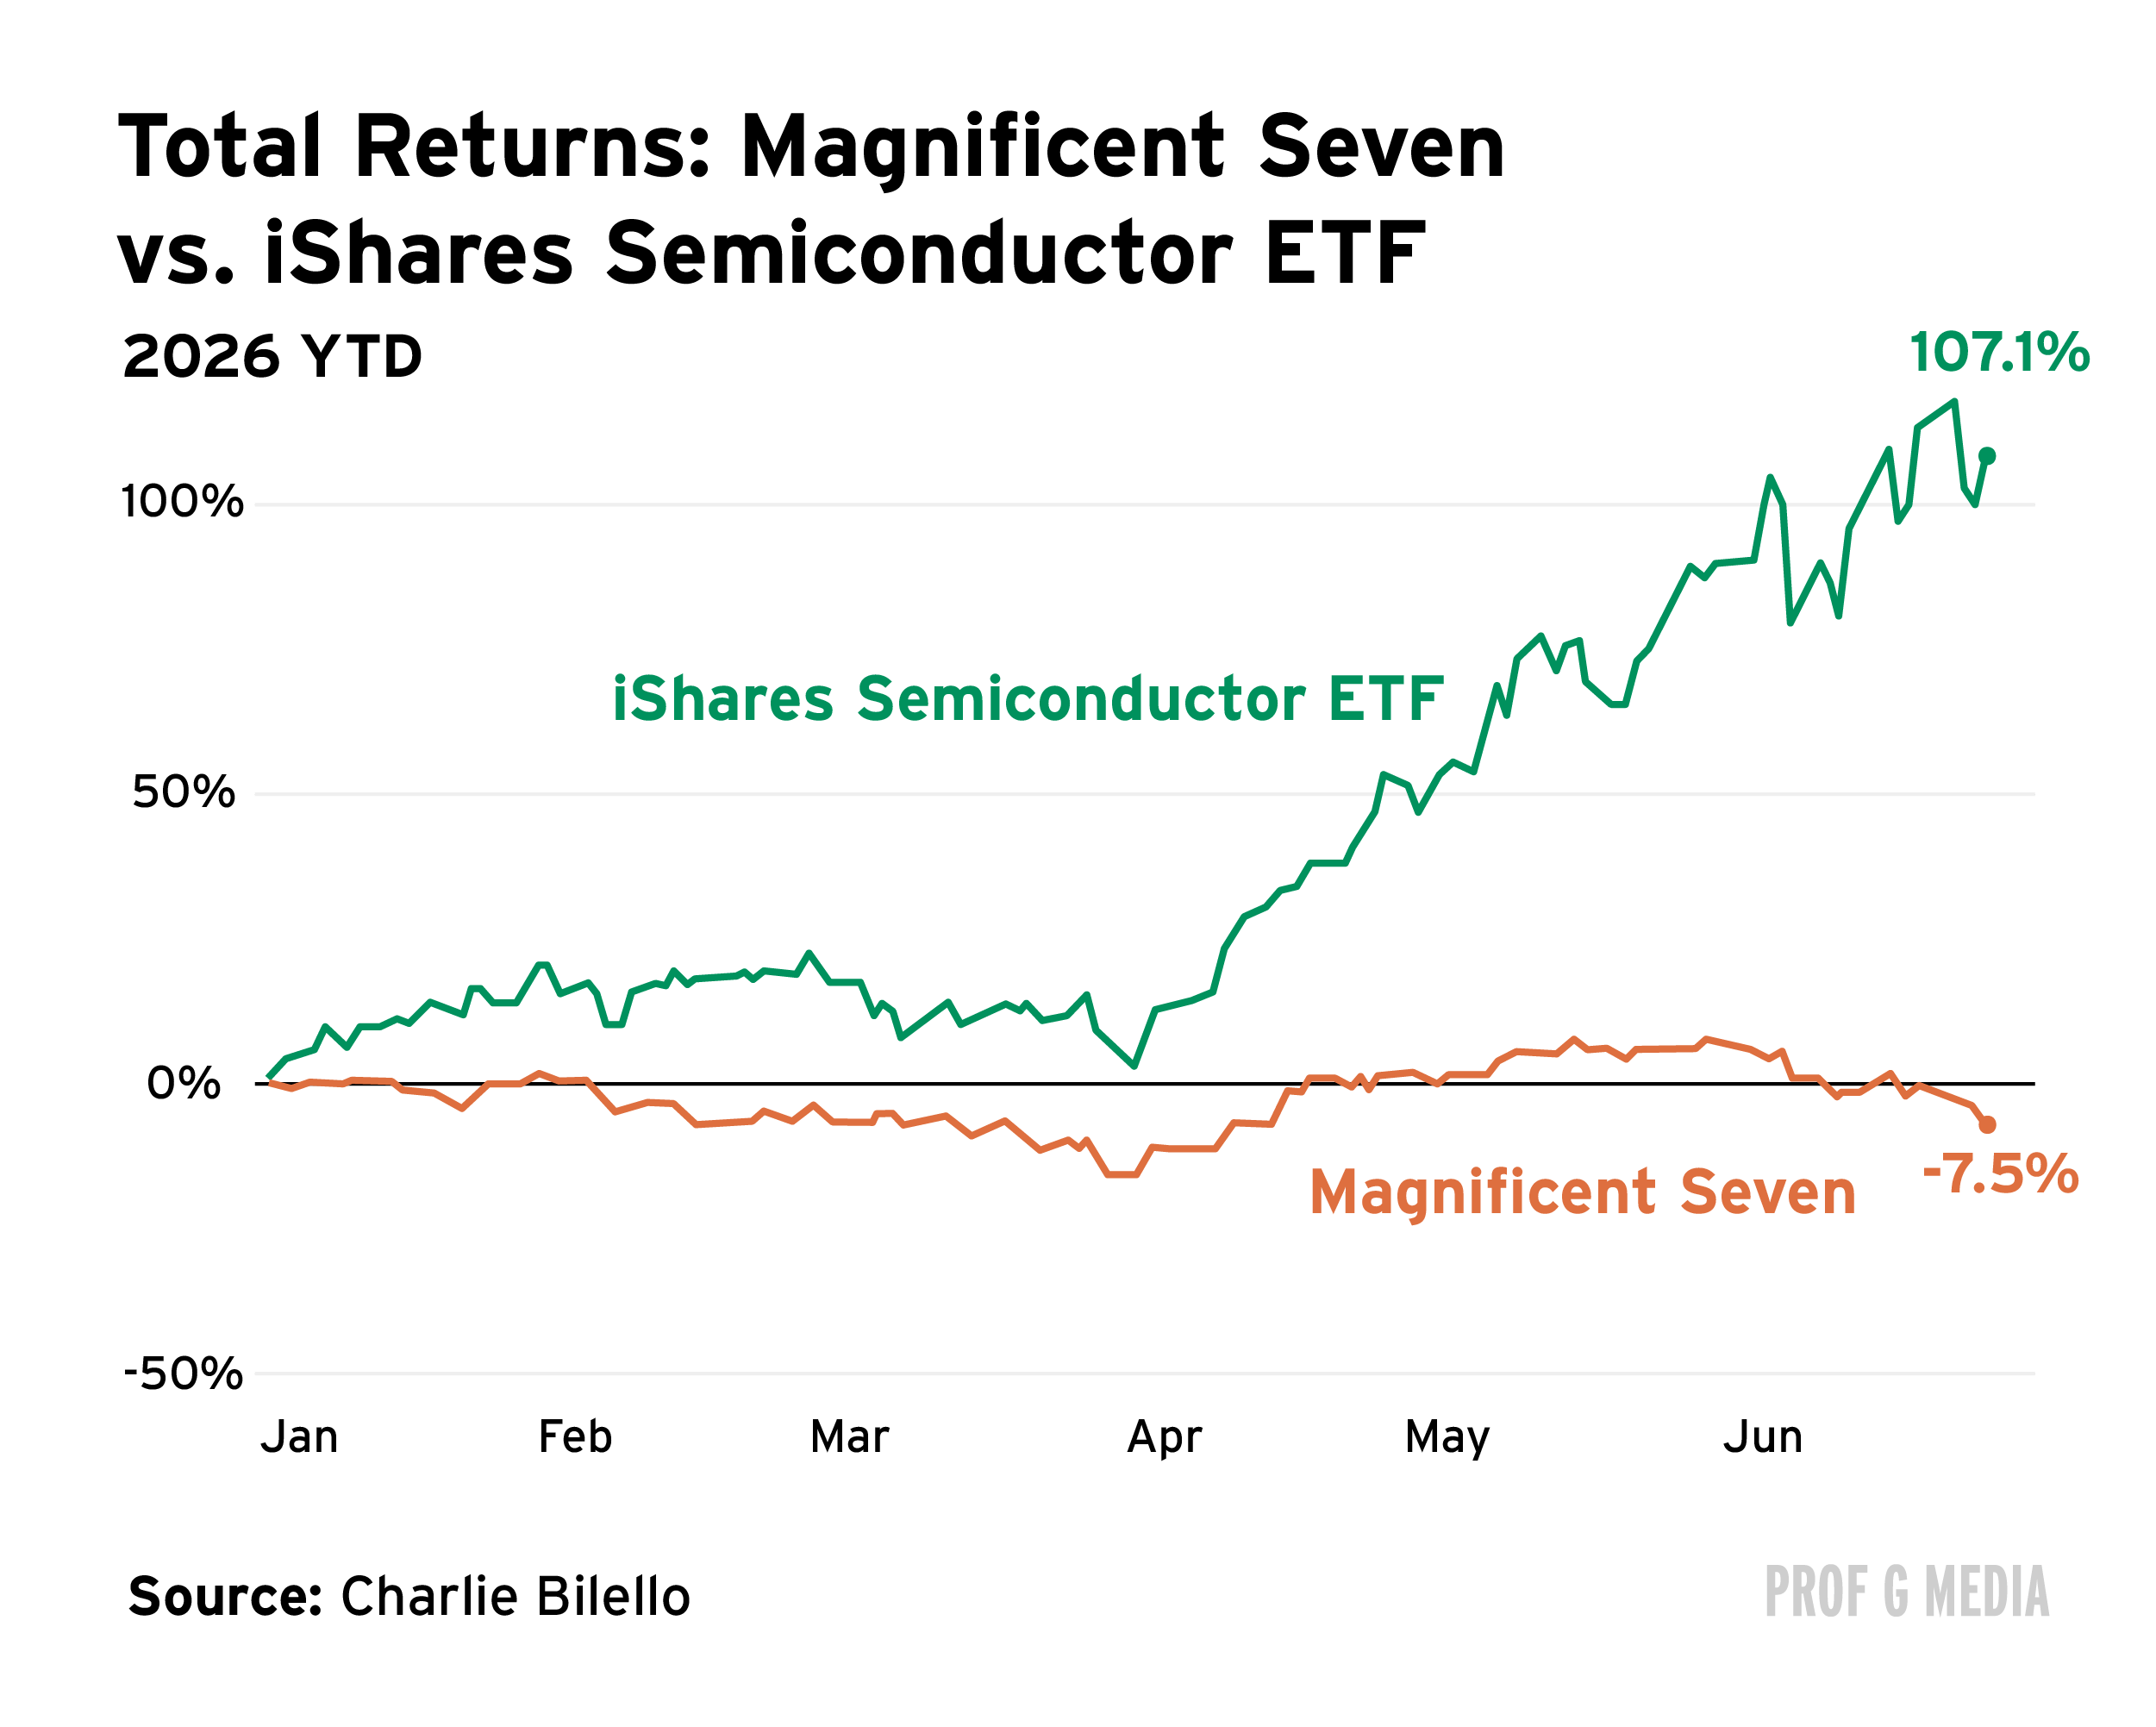
Meanwhile, investors have piled into memory chip companies, whose products help power AI and other consumer electronics. Samsung, Micron, and SK Hynix are now the 10th-, 13th-, and 14th-most-valuable public companies in the world, surpassing Berkshire Hathaway and JP Morgan Chase.
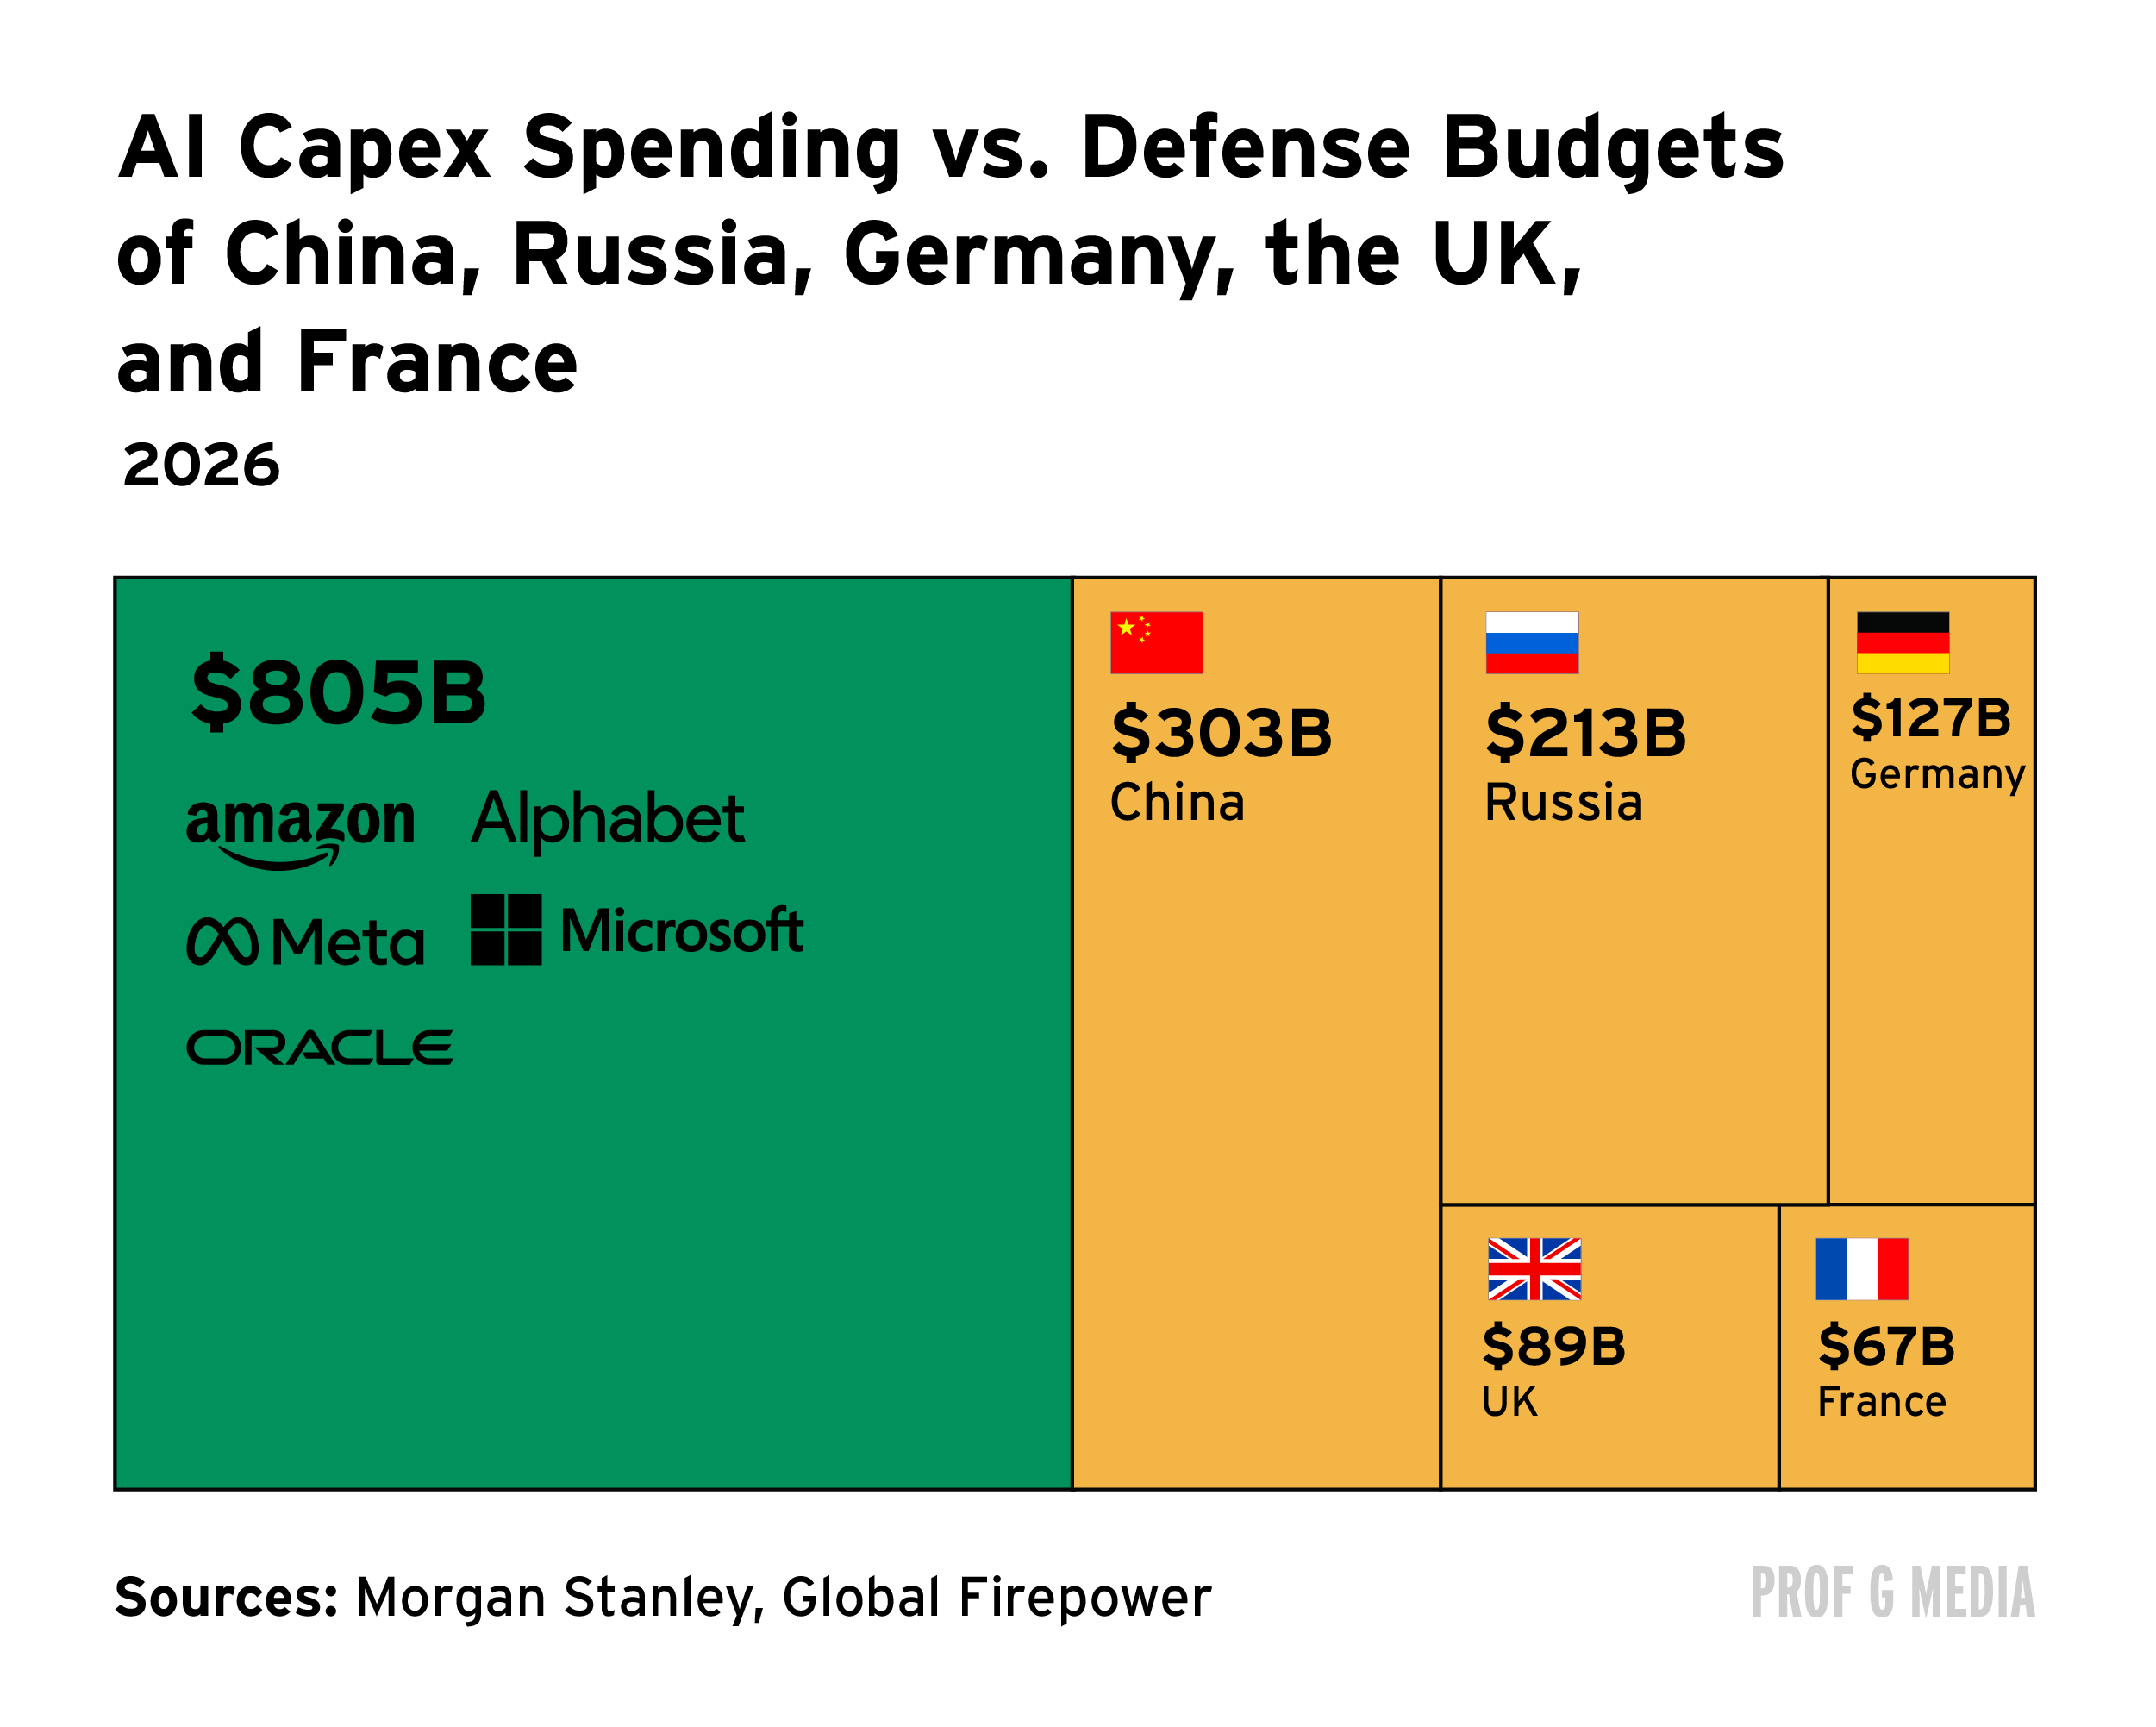
In many ways, the rotation looks rational. The hyperscalers will spend $805 billion on capex this year, up from $449 billion in 2025 — consuming 93% of their cash flows from operations, compared with 33% in 2023.
For that bet to pay off, AI revenues need to be enormous. So far, global AI sales exceeded depreciation costs in Q1 — but just barely, and that margin is under pressure as competition from China and business backlash push AI prices down.

Depreciation is an accounting method that spreads the cost of a major asset (like a factory, airplane, or computer) over the years it’s expected to be used. Instead of recording the full cost up front, companies expense a portion each year to reflect the asset’s loss of value as it ages.

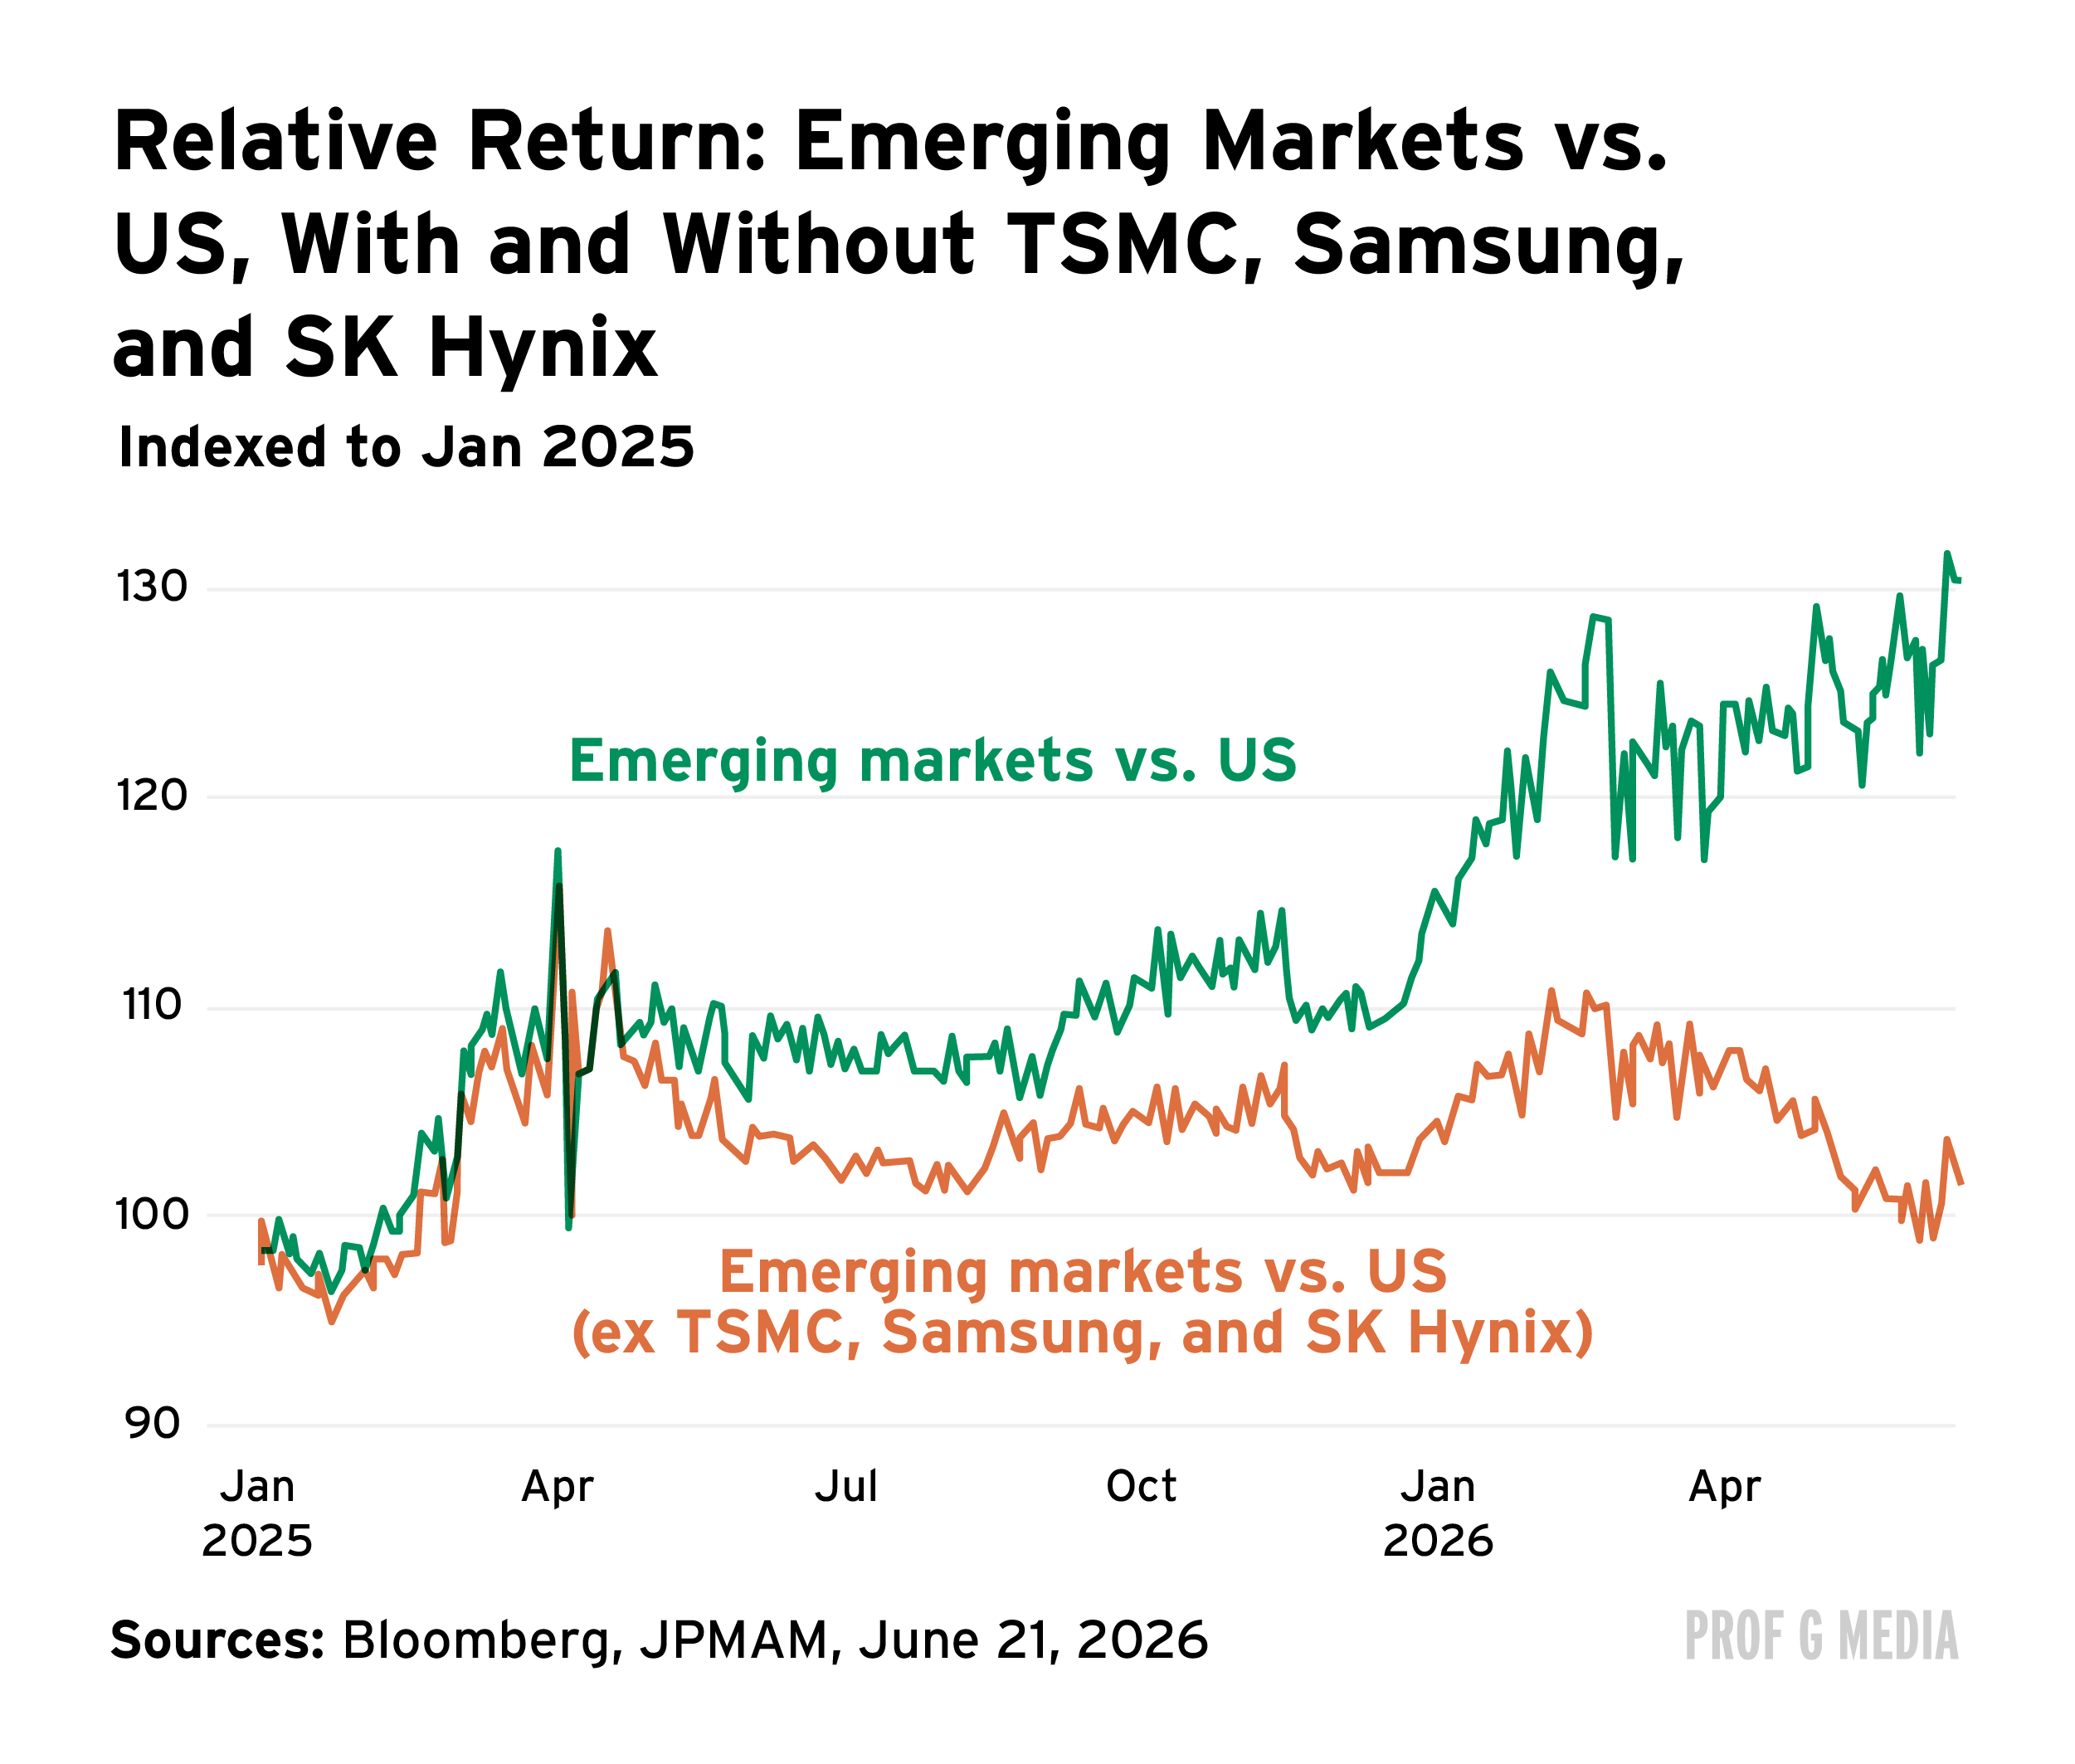
The memory boom has had a knock-on effect on emerging markets. SK Hynix and Samsung, which are listed in South Korea, and TSMC, listed in Taiwan, have helped push the emerging markets index excluding the U.S. ($ACWX) up 13% year to date.
Beyond chips, there’s been a genuine broadening of the market as investors look for value in a historically expensive environment. Companies like GE Aerospace, FedEx, and Caterpillar are up 47%, 82%, and 164%, respectively, over the past year, and the Russell 2000, the small-cap index, hit a record high last week.

Inflation Returns. Here’s What It Means for the Second Half of 2026
Inflation is now running at a three-year high. The Personal Consumption Expenditures Price Index (PCE) rose 4.1% last month, and core PCE, which strips out food and energy, came in at 3.4%.
This raises two key questions: Will the Fed raise interest rates this year to combat inflation, and what do higher prices mean for the American consumer?
Energy has been one of the biggest drivers of inflation, and last week, oil prices declined 7% after a new deal opened the Strait of Hormuz. However, over the weekend, the U.S. and Iran traded new attacks, and oil futures jumped as much as 1.5%. Even if the truce to keep the strait open holds, it will be months before lower oil prices register at the gas pump.
And — there’s a new inflationary culprit waiting to take energy’s place.
The AI buildout is becoming an inflation catalyst by driving up costs for consumer electronics and electricity.
Nintendo, Microsoft, Sony, and Apple have all raised prices on their devices, and data centers are expected to push consumer electricity prices up 6% this year and next. Markets are now pricing in a 64% likelihood that Fed Chair Kevin Warsh raises rates as early as September.
Higher prices and higher interest rates would strain the engine of the American economy: consumer spending. There are already warning signs. Consumer spending grew 0.5% in Q1 — the weakest pace in four years. The personal saving rate fell to 2.6% in April, lower than at almost any point since 2008, and a recent NY Fed report noted a “remarkable” increase in food insecurity among American families.

Over the past 25 years, every time inflation has run hot and the Fed has had to hike rates, markets have corrected. I’m not saying one causes the other, but the correlation is there. If inflation stays roughly where it is, markets can probably live with that. But if it starts climbing again, I don’t see how stocks hold at these levels.
Then there’s the new Fed chair. Kevin Warsh spent 15 years on the outside criticizing the Federal Reserve, and now he has the keys. I don’t think Trump is going to bully him into doing anything — he tried that with Jerome Powell, and it completely failed. No Fed chair wants to be remembered as the guy who let inflation get out of control. Warsh is going to have his eye on the ball.
What I think he’s actually doing with his communications policy is signaling that he wants markets more scared and less dependent on the idea that the Fed will always step in when things go wrong.

Are We in Dot-Com Territory? Does It Matter?
The stock market is trading near its most expensive valuation ever. The Shiller CAPE ratio, which compares the current price of the S&P 500 to inflation-adjusted earnings over the previous 10 years, is currently at 41. Its historical average is 17, and it has crossed 40 only twice before.
The first time was during the dot-com era. The ratio peaked at 44 in December 1999, and within months the bubble burst, sending the S&P 500 and Nasdaq down 49% and nearly 80% peak-to-trough respectively. The second time was January 2022, when the ratio briefly touched 40 before a nine-month bear market wiped out 25% of the S&P 500’s value.
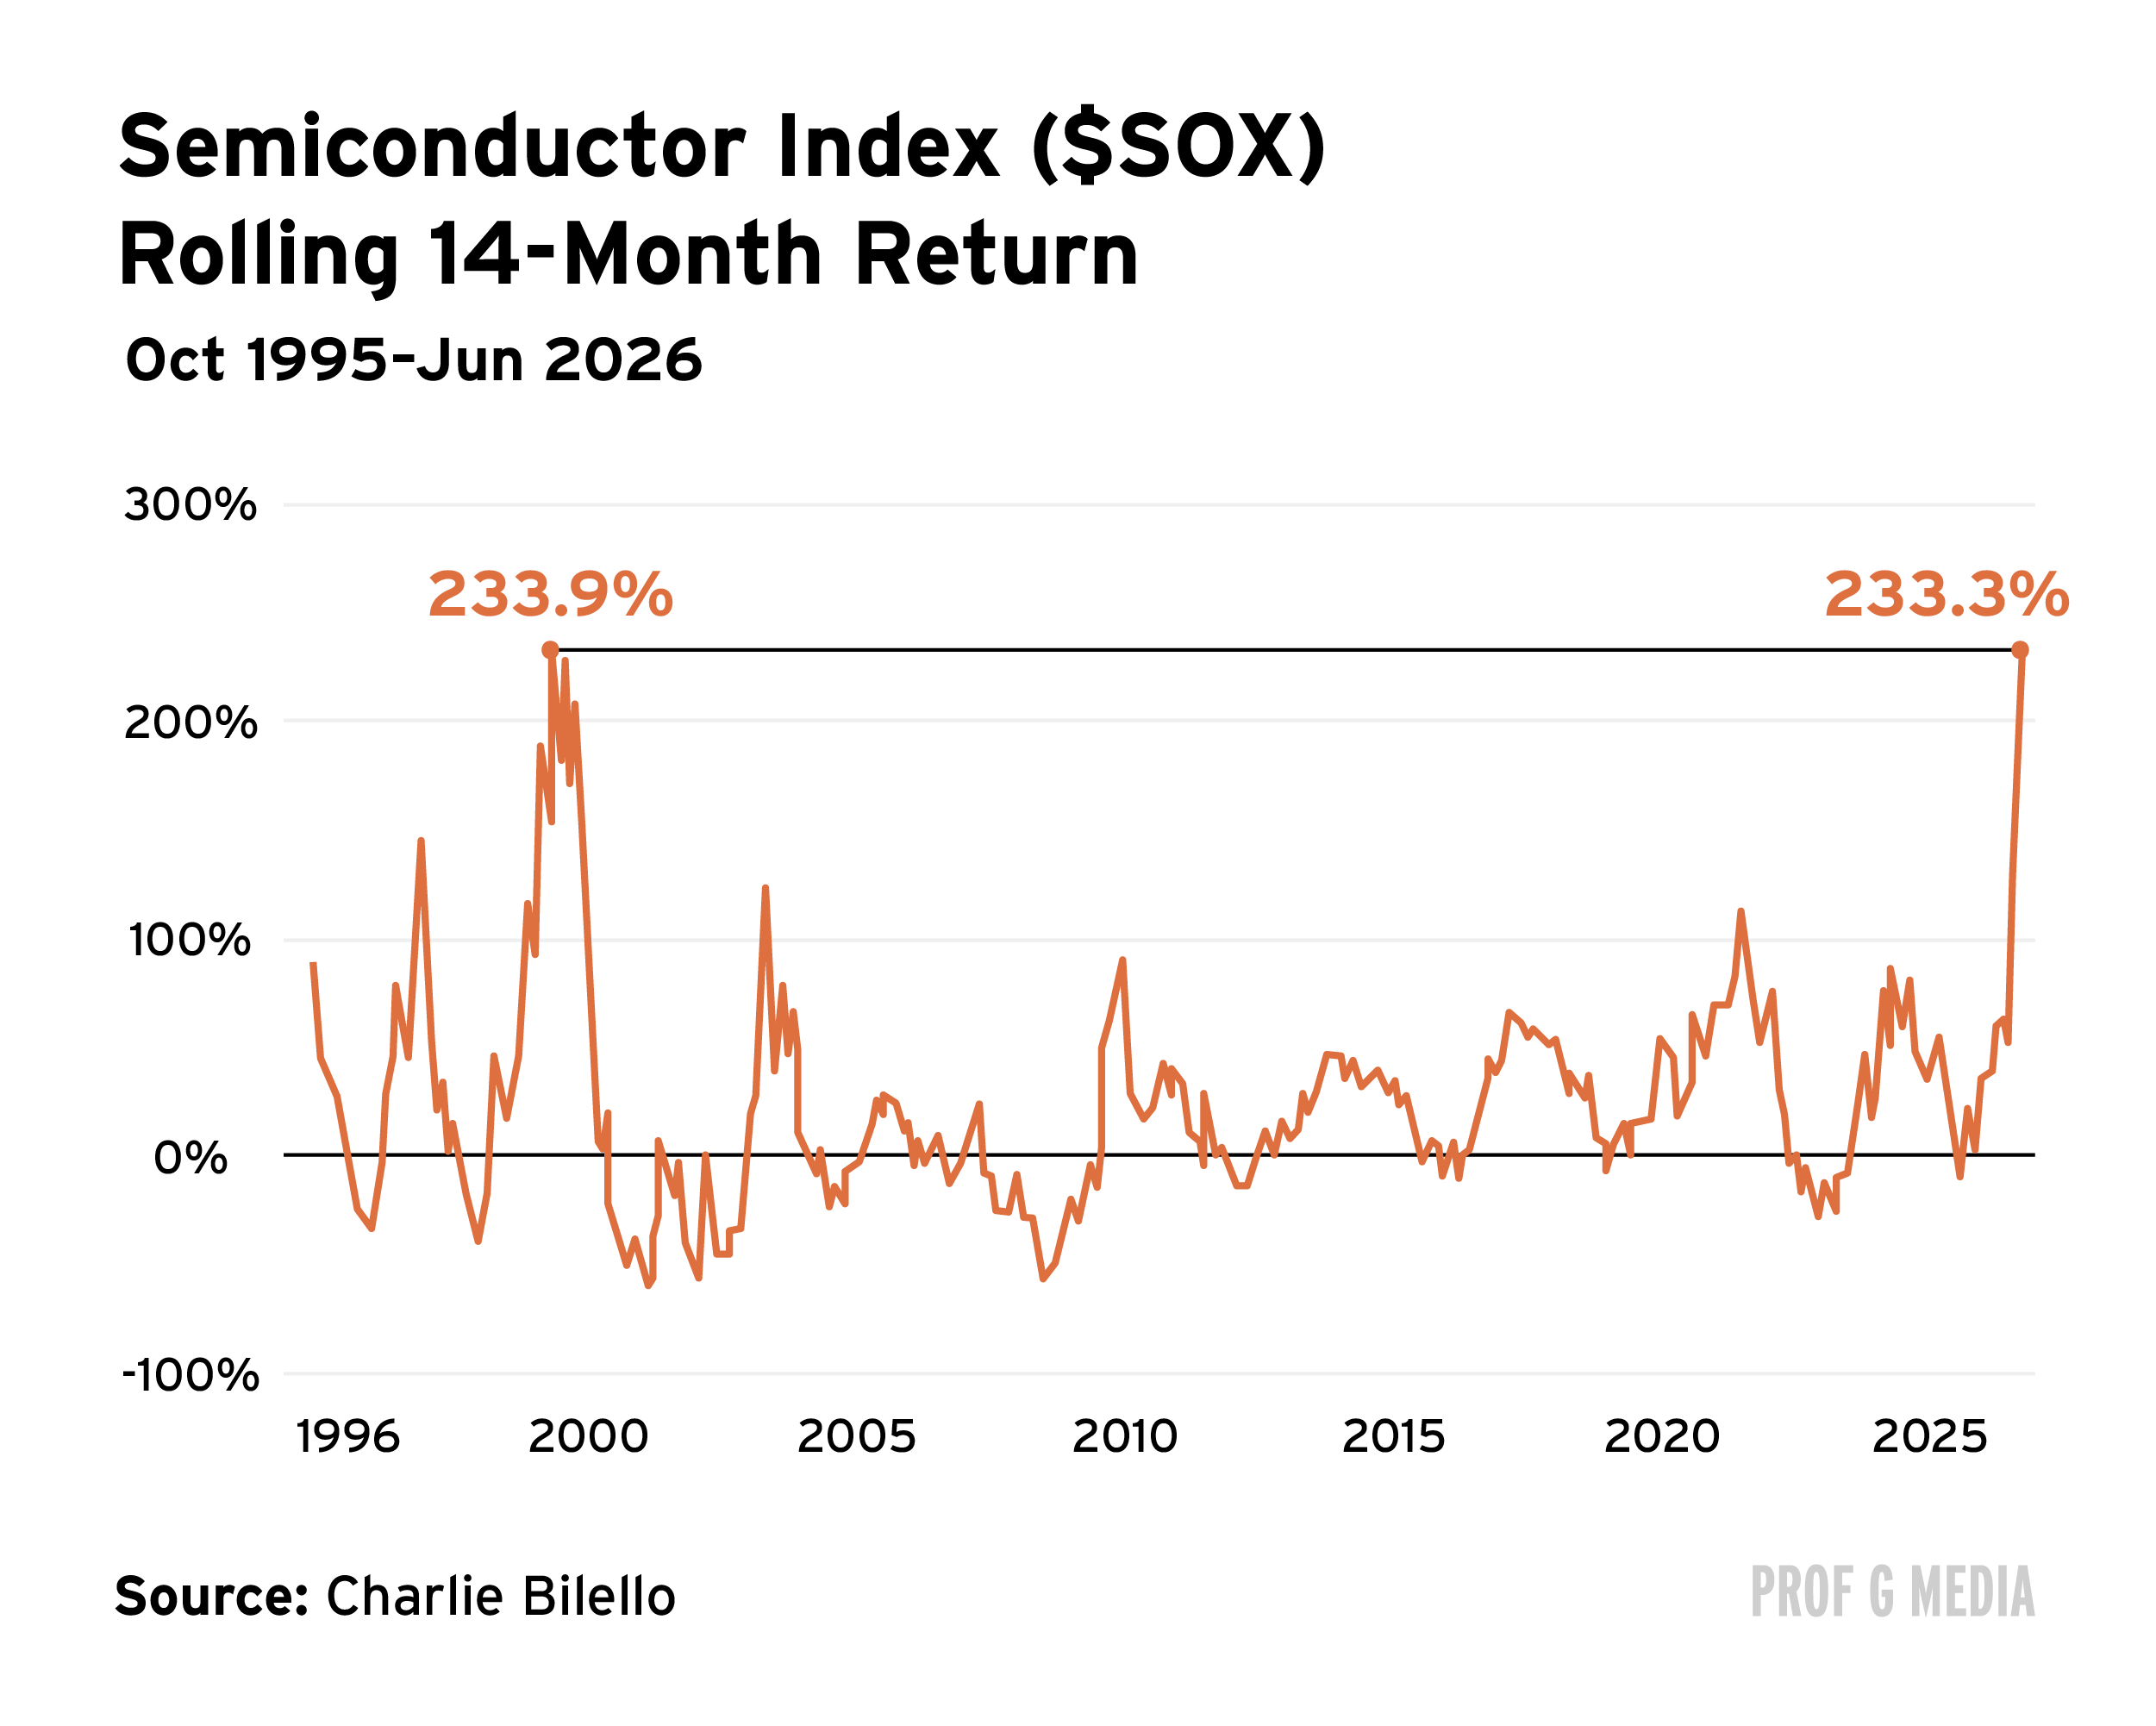
There’s one more uncomfortable data point, and it’s tied to the catalyst behind the market’s record gains. The only other time the semiconductor index gained more than 230% in a 14-month span was December 1998 to February 2000. The dot-com bubble burst the following month.

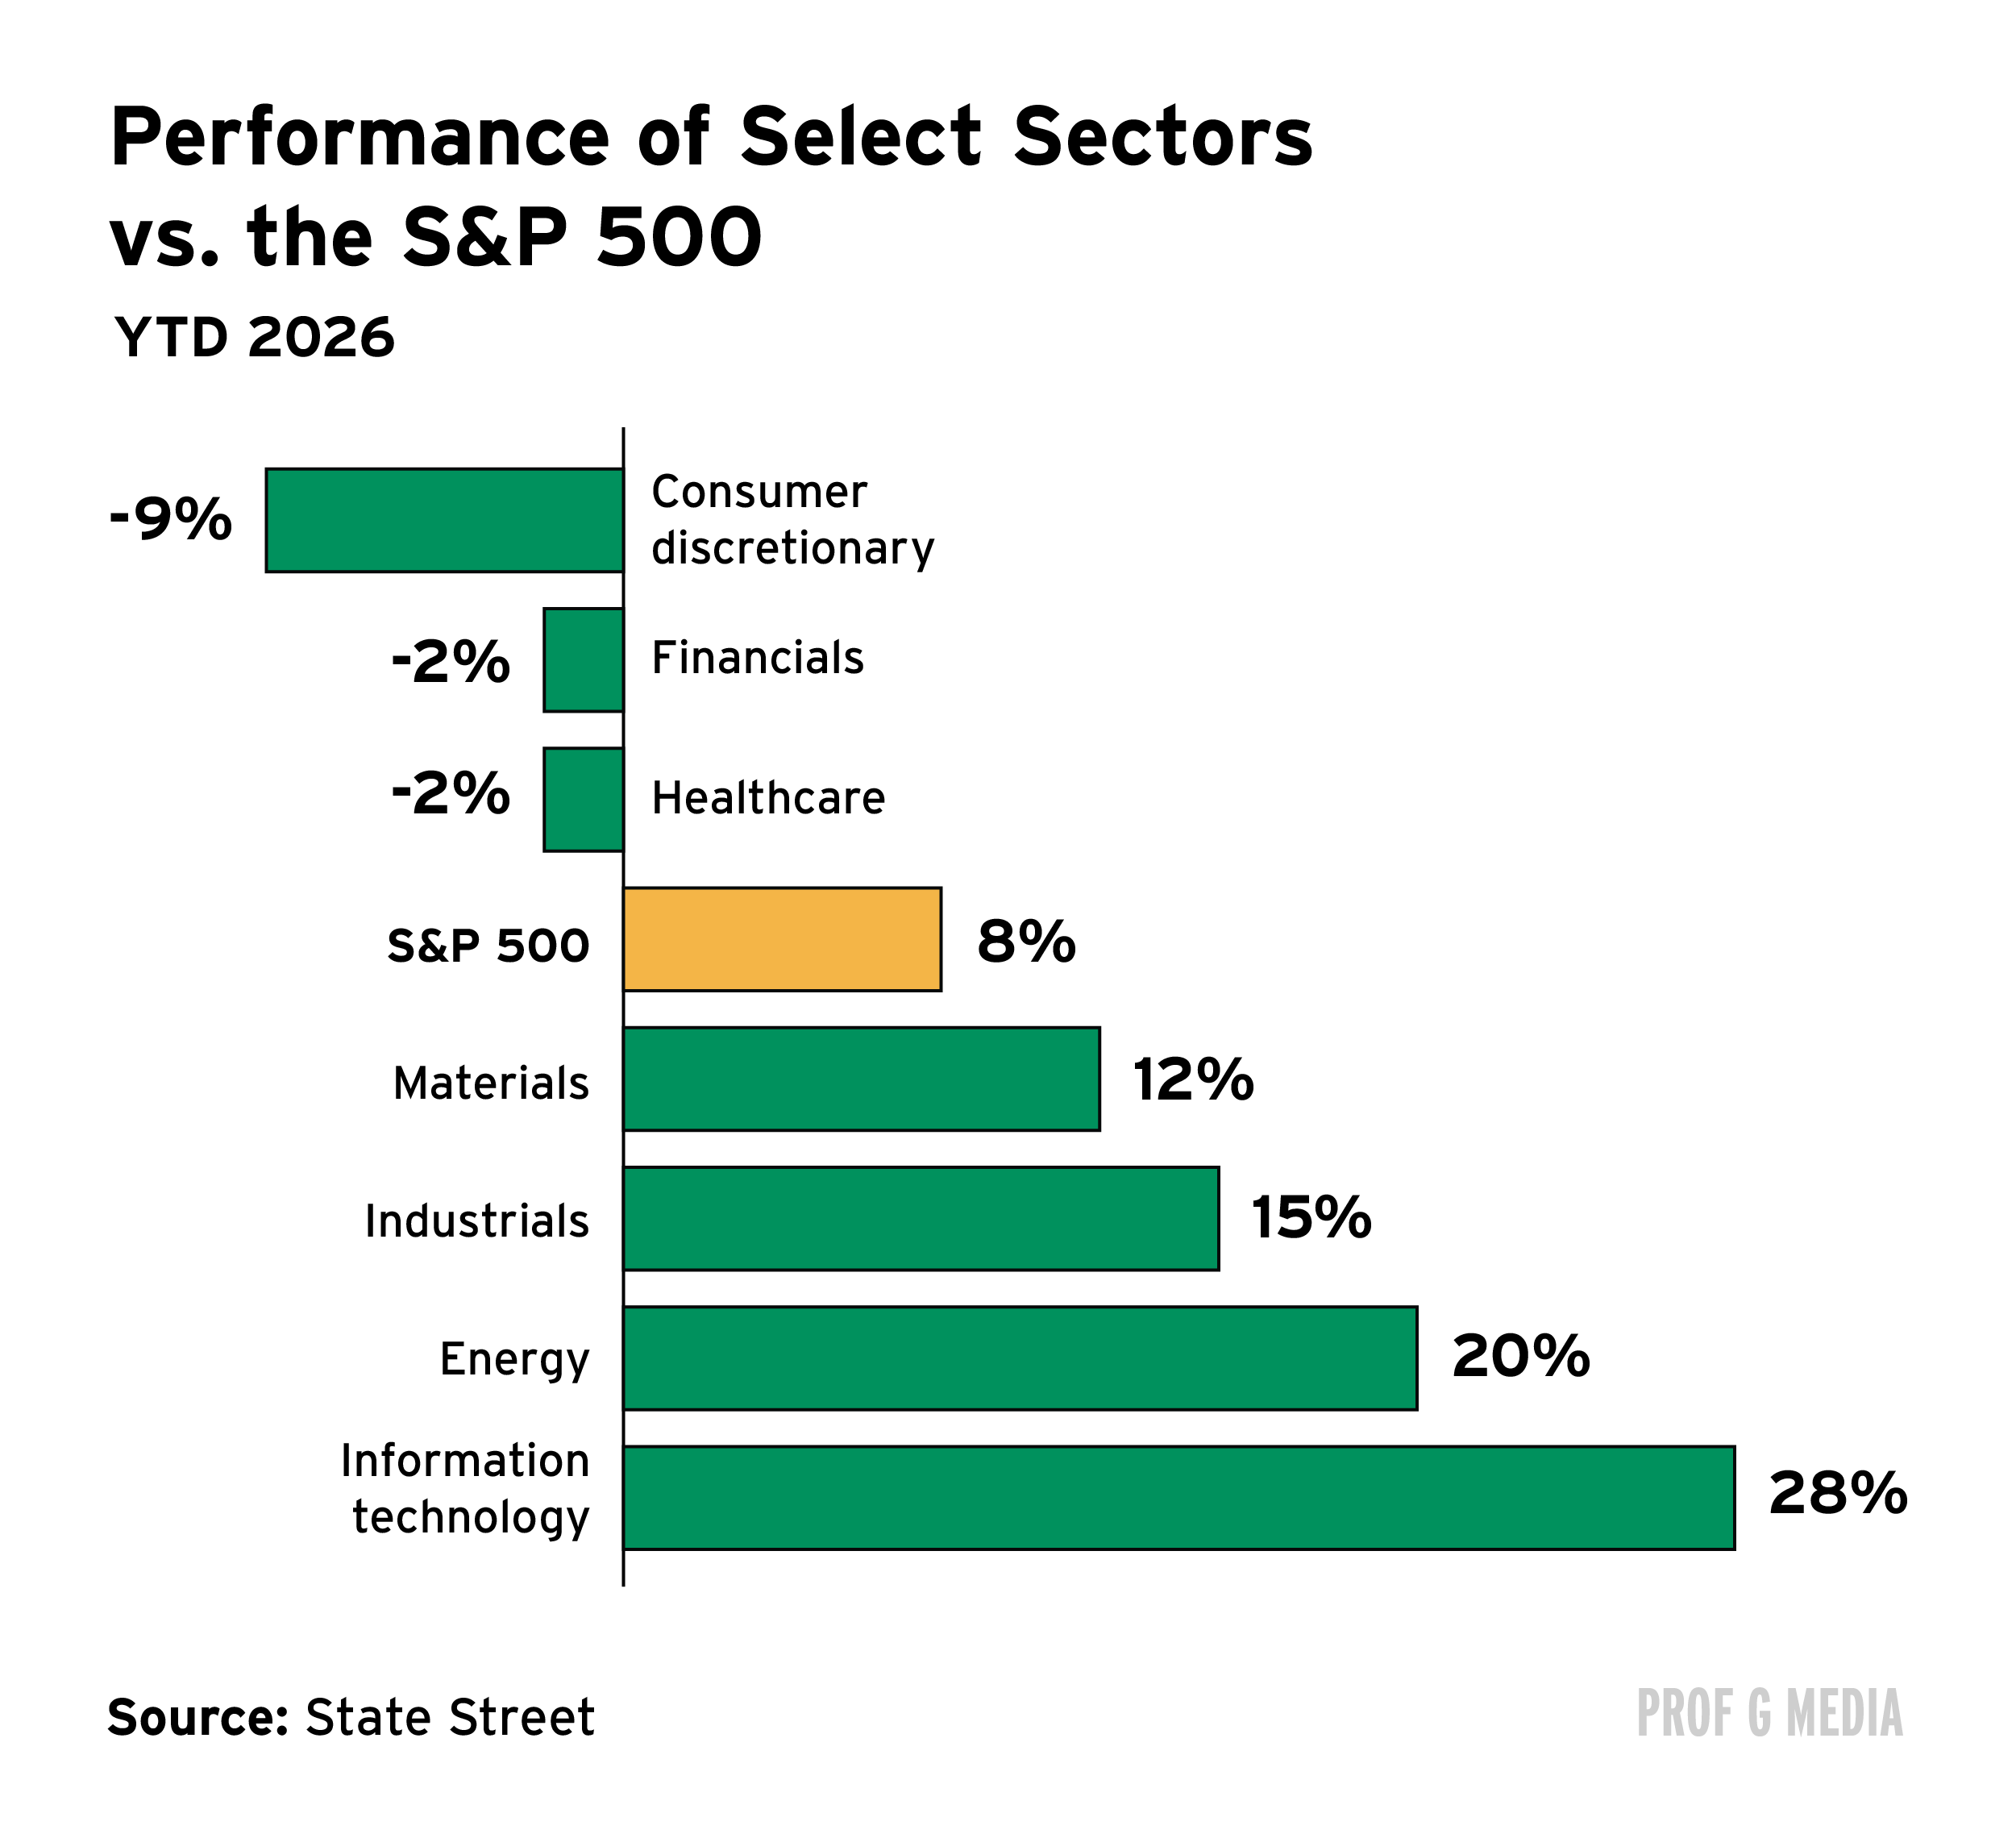
The whole market looks expensive. The only sectors trading below their five-year average price-to-sales multiples are real estate, telecom, and healthcare.
That said, I think a correction from here looks a lot more like 2022 than 2000. The big tech companies — Meta, Google, Amazon — have the cash to fund this buildout, so this isn’t a housing bubble situation where the problem is at the heart of every American family’s finances.

The most expensive thing I’ve ever done with my own money is get out of a bubble too early. You miss out on a lot of gains doing that.
What makes me nervous now, however, is that the momentum has stopped. For the past six weeks or so, markets keep trying to rally and they can’t. Micron just put out earnings that were better than anyone expected, but the Nasdaq is still down. What does a man have to do to get this market moving? A trendless market is the most unsettling one.
There’s also a data series from FINRA that tracks margin debt in securities accounts. That line is up and to the right right now. Leveraged ETFs have been growing, too. So there is clearly an appetite for speculative leverage out there. The question is whether the people outside the AI circle are using borrowed money to bet on what happens inside it. In 2008, European banks had leveraged exposure to American housing and nobody knew. You don’t find out where the leverage actually is until prices start falling.


At the start of every year, I make predictions. This year, I’m holding myself accountable by doing a midyear check-in. Join me live on Substack Tuesday, June 30, at 3 p.m. EDT. The livestream is exclusive to paid subscribers. Register here. And if you aren’t a paid subscriber, but want in, upgrade here.

The midterms will not matter for markets. Why? Midterms are about Congress, and what we’ve learned about Trump is that he doesn't give a sh*t about checks and balances. Trump has issued more than twice as many executive orders in this term than Congress has passed bills. In contrast, Biden issued four times fewer executive orders than Congress passed bills.

The U.S. doesn’t produce enough missiles
What do America’s earliest menus teach us about America?
Is the World Cup a festival for corporate has-beens?